Kwadratische formules en vergelijkingen: Kwadratische formules
 Parabolen
GrafiekDe grafiek van een kwadratische formule \[y=\blue ax^2+\green bx+\purple c\] heet een parabool.
Als #\blue a \gt 0# dan is de grafiek een dalparabool.
Als #\blue a \lt 0# dan is de grafiek een bergparabool.
Een dalparabool heeft een laagste punt en een bergparabool een hoogste punt. In beide gevallen noemen we dat de top van de grafiek.
De parabool is symmetrisch met als #\orange{\text{symmetrieas}}# de verticale lijn door de top.
geogebra plaatje
Grafiek maken
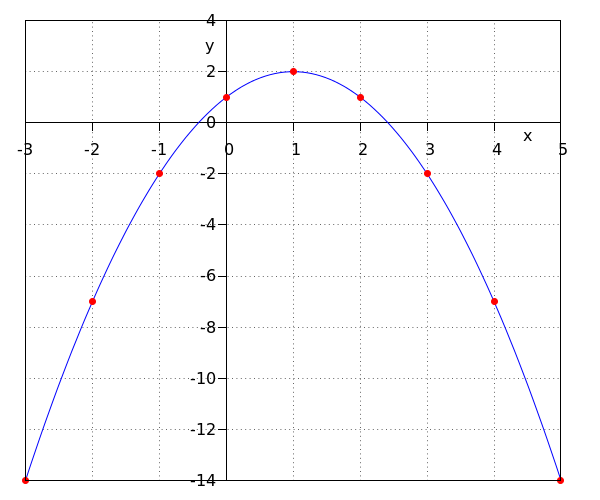
We kunnen een grafiek bij de kwadratische formule #y=-x^2+2x+1# maken door een tabel te maken en vervolgens deze punten in een assenstelsel te tekenen en te verbinden door een vloeiende kromme.
Tabel
#\begin{array}{l|c|c|c|c|c|c|c|c|c} x & -3 & -2 & -1 & 0 & 1 & 2 & 3&4&5\\ \hline y & -14 & -7 & -2 & 1 & 2 & 1 & -2 &-7 & -14 \end{array}#
We vinden deze waarden door de #x#-waarde te substitueren in de formule.
Grafiek
We tekenen de punten uit de tabel in het assenstelsel en verbinden ze met een vloeiende kromme.
Bekijk de formule #y=4\cdot \left(x-7\right)\cdot \left(x+3\right)#. Ligt het punt #\rv{2, -100}# op de grafiek van deze formule?
Ja
We substitueren #x=2# in de formule. Dat gaat als volgt:
\[y=4\cdot \left((2)-7\right)\cdot \left((2)+3\right)=-100\]
Dus #\rv{2, -100}# is wel een punt op de grafiek.
Ontgrendel volledige toegang

Toegang voor leraar
Vraag een demo account aan. Wij helpen je graag op weg met onze digitale leeromgeving.